Author: Evan Shelley

  • From restoring roads to advancing clean energy: How are states spending federal infrastructure dollars?

    From restoring roads to advancing clean energy: How are states spending federal infrastructure dollars?

    Workers moving equipment on a railway.
    setthayos sansuwansri // Shutterstock

    FIND DAILY TRUCK PARKING IN NEARLY EVERY STATE

    On the road and looking for a daily truck parking space? Find the closest daily parking spot in a

    matter of seconds.

    From restoring roads to advancing clean energy: How are states spending federal infrastructure dollars?

    Deadly collapses of structures like Baltimore’s Francis Scott Key Bridge and an elevated section of Interstate 95 in Philadelphia are dramatic examples of American infrastructure failures. But millions more Americans are affected daily by dated and deteriorating structures across the country.

    Americans make 178 million daily trips across structurally deficient bridges. Up to 10 million American households don’t have safe drinking water. More than 30 million Americans live in areas that lack high-speed internet. Climate and extreme weather events have killed nearly 2,000 Americans and caused over $600 billion in damages in just the past five years.

    On the whole, U.S. infrastructure is ill-equipped for the demands of modern-day life. In response, the federal government has been pumping money into making repairs and improvements across the country through the Infrastructure Investment and Jobs Act of 2021; the CHIPS and Science Act of 2022, which funds the domestic production of semiconductors and promotes various activities at science agencies; and the Inflation Reduction Act of 2022. Through these, the federal government has announced $582.8 billion in funding toward public infrastructure, semiconductor development, and clean energy across the nation and its territories.

    But how do these investments shake out on a local level? Truck Parking Club used White House public investments data to analyze how states are spending federal infrastructure dollars in their communities. This data represents public projects announced as of July that are funded by the Bipartisan Infrastructure Law, Inflation Reduction Act, and CHIPS and Science Act. Projects spanning multiple states were not included in state analyses, but are reflected within national statistics.

    Infrastructure encompasses all basic, necessary facilities and systems that service the country’s residents. This takes many forms, including roads, power grids, water service, and wireless internet. Much of U.S. infrastructure is aging and overburdened, creating delays, demanding maintenance, and in some cases, posing safety risks.

    The inherent issues with safety, security, and the economy led to bipartisan support for the landmark government investments of the 2020s. In all, the Bipartisan Infrastructure Law will invest $1.2 trillion in transportation and infrastructure; the Inflation Reduction Act will invest $369 billion in energy production, manufacturing, and reducing carbon emissions; and the CHIPS and Science Act will invest $52.7 billion to fund in-country semiconductor research, development, and manufacturing through 2027.

    Several of the largest projects will give billions to technology corporations to build manufacturing facilities stateside, with an aim to create a domestic supply of semiconductor chips. These small devices are found in many everyday items including computers, smartphones, cars, medical equipment, appliances—nearly any electronic device imaginable. The Department of Commerce has struck deals with Intel, TSMC, Samsung, and Micron to construct and expand these facilities.

    Another set of leading investments was the National Clean Investment Fund grants, which provided nearly $14 billion to three green financing institutions. One plans to establish a U.S. national green bank, which will help connect green lenders to fund projects in low-income communities. All three investments are intended to provide affordable loans and other financing for green projects, such as solar installations, homes built with clean technologies, and high-efficiency electrical upgrades.

    More than $26 billion has been allocated for projects in “resilience,” which refers to efforts to mitigate climate change and other threats. Examples of resilience projects include infrastructure to minimize or prevent damage from flooding or using funds to employ more wildland firefighters.

    A bar chart showing federal transportation investments by subcategory, including roads, public transportation, rail, ports, and others.

    PARK YOUR TRAILER WITH NO HASSLE

    Store your trailer in a safe place with a state-of-the-art platform that locates trailer parking near me.

    Transportation focus

    Transportation projects dominate infrastructure funding allocations, according to the data so far. Just over half of federal dollars announced so far are geared toward transportation. Within the category, most funding has been doled out to build, repair, or modernize roads, bridges, and other major projects.

    Some projects hit on several funding targets. For instance, the proposal to replace the bridge connecting Washington and Oregon via I-5 has received $2.1 billion in federal grants, and project planners expect they could receive another $1 billion. Parts of the existing bridge are over 100 years old, and the existing structures are at risk of collapsing in an earthquake. The new bridge is expected to implement new safety features, add auxiliary lanes, and expand public transit and active transportation options.

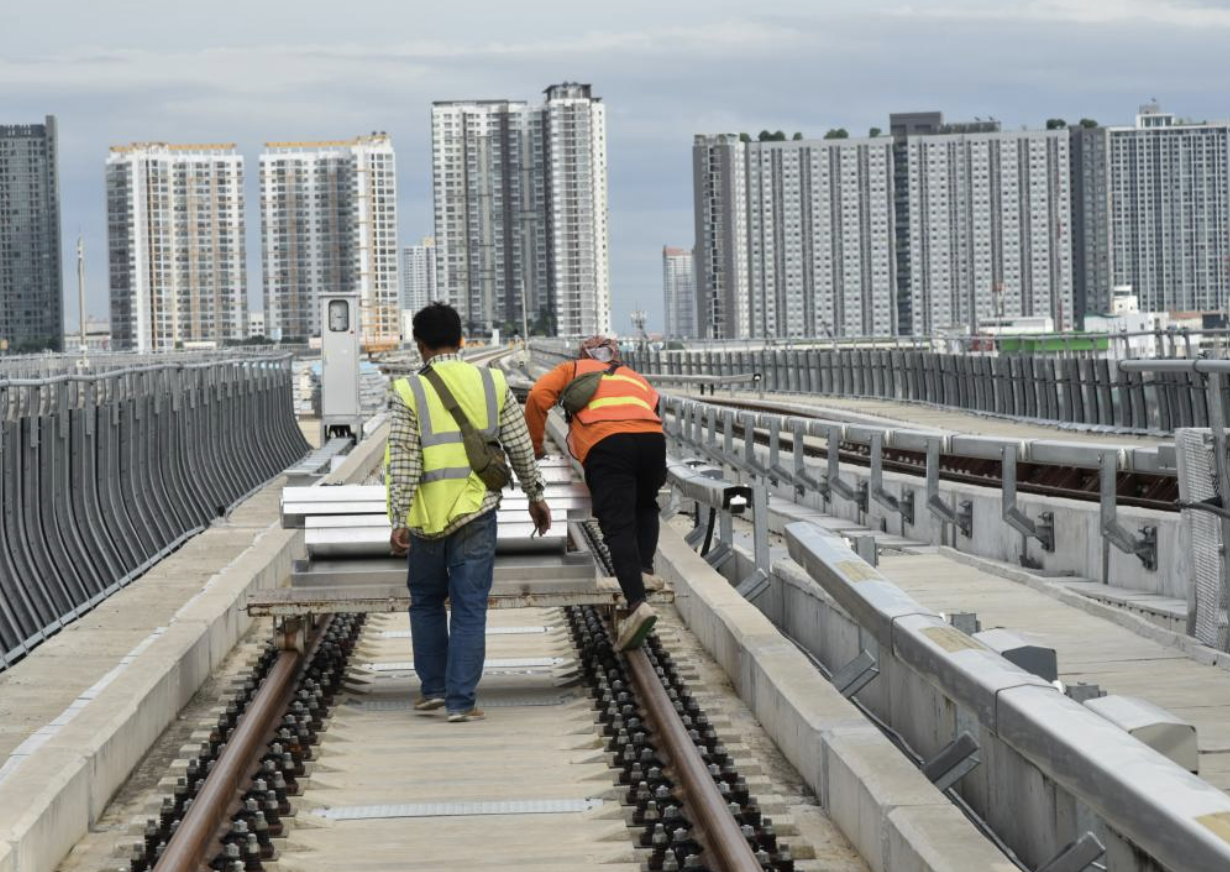
    The Bipartisan Infrastructure Law is also making the largest investment in passenger rail since Amtrak was created. Within the transportation category, the two largest line items in the project database are to build new railroad tunnels in Baltimore and under the Hudson River between New Jersey and New York.

    Transportation projects claimed a majority of fund distributions in all but two states, Wyoming and Arizona. In the latter state, the U.S. has said it will provide up to $6.6 billion to TSMC Arizona Corp. to support the development of three advanced semiconductor manufacturing facilities. This is the third-largest project investment that has been announced and the largest to go into a single state. In Wyoming, the other exception, the U.S. is partnering with TerraPower to build a nuclear power plant. The U.S. could invest up to $2 billion in the reactor in its efforts to advance clean energy.

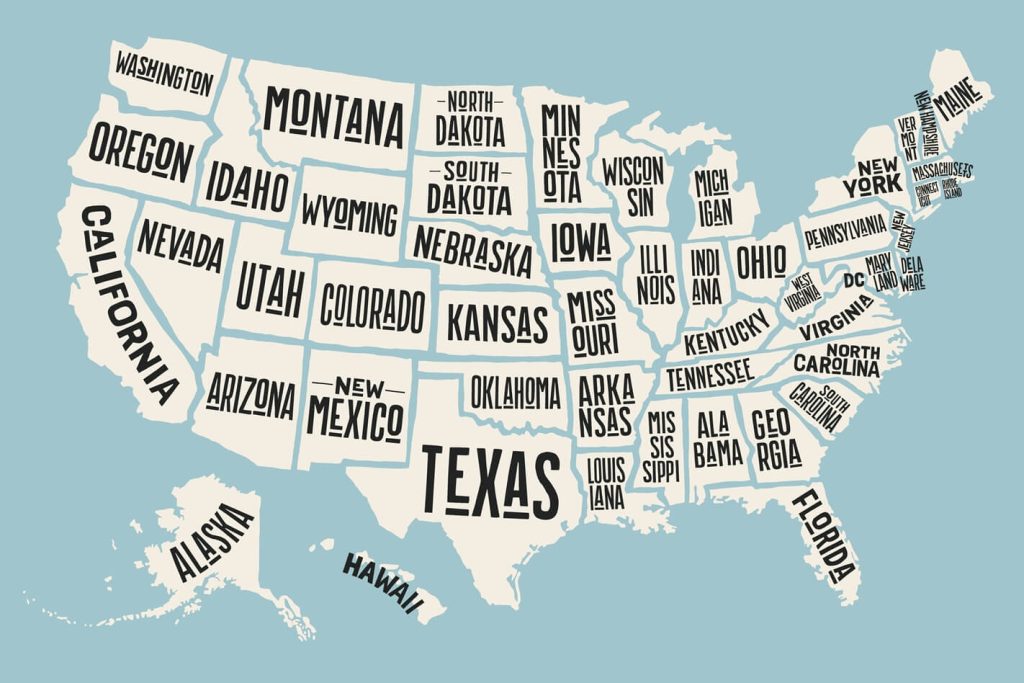
    Read on to see how transportation and other federal infrastructure dollars are being allocated in your state. States are listed in alphabetical order, with funds broken down by major categories provided in the White House data.

    Kevin Ruck // Shutterstock

    Alabama

    The federal government has announced $7.1 billion in funds toward Alabama infrastructure projects. Here’s how they break down:
    – Transportation: 58.2% (Mostly in roads, bridges, and major projects)
    – Clean energy, buildings, and manufacturing: 5.8%
    – Broadband internet: 24.2%
    – Clean water: 6.3%
    – Resilience: 1.8%
    – Environmental remediation: 2.5%
    – Climate-smart agriculture: 0.5%
    – Parks and conservation: 0.2%
    – Other: 0.5%

    Canva

    Alaska

    The federal government has announced $8.8 billion in funds toward Alaska infrastructure projects. Here’s how they break down:
    – Transportation: 43.7% (Mostly in roads, bridges, and major projects)
    – Clean energy, buildings, and manufacturing: 12.6%
    – Broadband internet: 18.0%
    – Clean water: 15.4%
    – Resilience: 6.9%
    – Environmental remediation: 1.3%
    – Climate-smart agriculture: 0.0%
    – Parks and conservation: 0.4%
    – Other: 1.6%

    Sean Pavone // Shutterstock

    Arizona

    The federal government has announced $16.2 billion in funds toward Arizona infrastructure projects. Here’s how they break down:
    – Transportation: 30.1% (Mostly in roads, bridges, and major projects)
    – Clean energy, buildings, and manufacturing: 6.3%
    – Broadband internet: 9.1%
    – Clean water: 6.9%
    – Resilience: 5.4%
    – Environmental remediation: 0.9%
    – Climate-smart agriculture: 0.1%
    – Parks and conservation: 0.3%
    – Other: 40.7%

    Canva

    Arkansas

    The federal government has announced $5.7 billion in funds toward Arkansas infrastructure projects. Here’s how they break down:
    – Transportation: 58.6% (Mostly in roads, bridges, and major projects)
    – Clean energy, buildings, and manufacturing: 5.1%
    – Broadband internet: 21.1%
    – Clean water: 5.6%
    – Resilience: 7.6%
    – Environmental remediation: 0.4%
    – Climate-smart agriculture: 1.2%
    – Parks and conservation: 0.3%
    – Other: 0.2%

    Marek Masik // Shutterstock

    California

    The federal government has announced $48.2 billion in funds toward California infrastructure projects. Here’s how they break down:
    – Transportation: 66.0% (Mostly in roads, bridges, and major projects)
    – Clean energy, buildings, and manufacturing: 11.1%
    – Broadband internet: 7.9%
    – Clean water: 7.6%
    – Resilience: 5.7%
    – Environmental remediation: 0.9%
    – Climate-smart agriculture: 0.1%
    – Parks and conservation: 0.4%
    – Other: 0.2%

    Canva

    Colorado

    The federal government has announced $8.3 billion in funds toward Colorado infrastructure projects. Here’s how they break down:
    – Transportation: 49.0% (Mostly in roads, bridges, and major projects)
    – Clean energy, buildings, and manufacturing: 13.9%
    – Broadband internet: 12.8%
    – Clean water: 10.6%
    – Resilience: 8.1%
    – Environmental remediation: 2.7%
    – Climate-smart agriculture: 0.1%
    – Parks and conservation: 0.6%
    – Other: 2.2%

    Sean Pavone // Shutterstock

    Connecticut

    The federal government has announced $7.0 billion in funds toward Connecticut infrastructure projects. Here’s how they break down:
    – Transportation: 83.4% (Mostly in roads, bridges, and major projects)
    – Clean energy, buildings, and manufacturing: 4.7%
    – Broadband internet: 3.8%
    – Clean water: 4.2%
    – Resilience: 1.6%
    – Environmental remediation: 1.5%
    – Climate-smart agriculture: 0.0%
    – Parks and conservation: 0.3%
    – Other: 0.4%

    Real Window Creative // Shutterstock

    Delaware

    The federal government has announced $1.7 billion in funds toward Delaware infrastructure projects. Here’s how they break down:
    – Transportation: 66.6% (Mostly in roads, bridges, and major projects)
    – Clean energy, buildings, and manufacturing: 6.5%
    – Broadband internet: 8.4%
    – Clean water: 13.9%
    – Resilience: 3.9%
    – Environmental remediation: 0.6%
    – Climate-smart agriculture: 0.1%
    – Parks and conservation: 0.1%
    – Other: 0.1%

    Washington D.C. skyline with highways and monuments.
    Sean Pavone // Shutterstock

    District of Columbia

    The federal government has announced $3.1 billion in funds toward District of Columbia infrastructure projects. Here’s how they break down:
    – Transportation: 64.6% (Mostly in public transportation)
    – Clean energy, buildings, and manufacturing: 16.1%
    – Broadband internet: 4.9%
    – Clean water: 7.8%
    – Resilience: 4.8%
    – Environmental remediation: 0.3%
    – Climate-smart agriculture: 0.0%
    – Parks and conservation: 1.4%
    – Other: 0.1%

    Mia2you // Shutterstock

    Florida

    The federal government has announced $18.4 billion in funds toward Florida infrastructure projects. Here’s how they break down:
    – Transportation: 64.1% (Mostly in roads, bridges, and major projects)
    – Clean energy, buildings, and manufacturing: 5.3%
    – Broadband internet: 12.2%
    – Clean water: 7.2%
    – Resilience: 8.7%
    – Environmental remediation: 2.0%
    – Climate-smart agriculture: 0.3%
    – Parks and conservation: 0.2%
    – Other: 0.1%

    Canva

    Georgia

    The federal government has announced $11.5 billion in funds toward Georgia infrastructure projects. Here’s how they break down:
    – Transportation: 63.2% (Mostly in roads, bridges, and major projects)
    – Clean energy, buildings, and manufacturing: 9.9%
    – Broadband internet: 15.6%
    – Clean water: 5.0%
    – Resilience: 2.7%
    – Environmental remediation: 2.1%
    – Climate-smart agriculture: 0.4%
    – Parks and conservation: 0.3%
    – Other: 0.9%

    Canva

    Hawaii

    The federal government has announced $2.9 billion in funds toward Hawaii infrastructure projects. Here’s how they break down:
    – Transportation: 65.0% (Mostly in roads, bridges, and major projects)
    – Clean energy, buildings, and manufacturing: 10.4%
    – Broadband internet: 8.5%
    – Clean water: 9.4%
    – Resilience: 3.3%
    – Environmental remediation: 0.4%
    – Climate-smart agriculture: 0.2%
    – Parks and conservation: 2.4%
    – Other: 0.3%

    Charles Knowles // Shutterstock

    Idaho

    The federal government has announced $3.4 billion in funds toward Idaho infrastructure projects. Here’s how they break down:
    – Transportation: 50.2% (Mostly in roads, bridges, and major projects)
    – Clean energy, buildings, and manufacturing: 10.2%
    – Broadband internet: 18.8%
    – Clean water: 9.4%
    – Resilience: 8.6%
    – Environmental remediation: 0.6%
    – Climate-smart agriculture: 0.2%
    – Parks and conservation: 1.4%
    – Other: 0.6%

    Sean Pavone // Shutterstock

    Illinois

    The federal government has announced $18.2 billion in funds toward Illinois infrastructure projects. Here’s how they break down:
    – Transportation: 66.5% (Mostly in roads, bridges, and major projects)
    – Clean energy, buildings, and manufacturing: 6.7%
    – Broadband internet: 8.6%
    – Clean water: 7.1%
    – Resilience: 8.1%
    – Environmental remediation: 2.5%
    – Climate-smart agriculture: 0.3%
    – Parks and conservation: 0.2%
    – Other: 0.1%

    Sean Pavone // Shutterstock

    Indiana

    The federal government has announced $8.3 billion in funds toward Indiana infrastructure projects. Here’s how they break down:
    – Transportation: 62.4% (Mostly in roads, bridges, and major projects)
    – Clean energy, buildings, and manufacturing: 12.5%
    – Broadband internet: 13.8%
    – Clean water: 7.0%
    – Resilience: 1.6%
    – Environmental remediation: 1.8%
    – Climate-smart agriculture: 0.4%
    – Parks and conservation: 0.4%
    – Other: 0.1%

    Jacob Boomsma // Shutterstock

    Iowa

    The federal government has announced $4.8 billion in funds toward Iowa infrastructure projects. Here’s how they break down:
    – Transportation: 68.7% (Mostly in roads, bridges, and major projects)
    – Clean energy, buildings, and manufacturing: 5.8%
    – Broadband internet: 11.2%
    – Clean water: 7.6%
    – Resilience: 4.0%
    – Environmental remediation: 0.9%
    – Climate-smart agriculture: 1.2%
    – Parks and conservation: 0.4%
    – Other: 0.2%

    Jacob Boomsma // Shutterstock

    Kansas

    The federal government has announced $3.7 billion in funds toward Kansas infrastructure projects. Here’s how they break down:
    – Transportation: 59.0% (Mostly in roads, bridges, and major projects)
    – Clean energy, buildings, and manufacturing: 10.1%
    – Broadband internet: 15.9%
    – Clean water: 8.5%
    – Resilience: 2.6%
    – Environmental remediation: 2.8%
    – Climate-smart agriculture: 1.0%
    – Parks and conservation: 0.1%
    – Other: 0.1%

    Rotorhead 30A Productions // Shutterstock

    Kentucky

    The federal government has announced $8.1 billion in funds toward Kentucky infrastructure projects. Here’s how they break down:
    – Transportation: 48.7% (Mostly in roads, bridges, and major projects)
    – Clean energy, buildings, and manufacturing: 15.9%
    – Broadband internet: 17.4%
    – Clean water: 4.3%
    – Resilience: 7.5%
    – Environmental remediation: 5.0%
    – Climate-smart agriculture: 0.4%
    – Parks and conservation: 0.2%
    – Other: 0.7%

    Sean Pavone // Shutterstock

    Louisiana

    The federal government has announced $9.5 billion in funds toward Louisiana infrastructure projects. Here’s how they break down:
    – Transportation: 57.6% (Mostly in roads, bridges, and major projects)
    – Clean energy, buildings, and manufacturing: 10.7%
    – Broadband internet: 18.0%
    – Clean water: 4.3%
    – Resilience: 6.7%
    – Environmental remediation: 2.0%
    – Climate-smart agriculture: 0.1%
    – Parks and conservation: 0.3%
    – Other: 0.3%

    Joseph Sohm // Shutterstock

    Maine

    The federal government has announced $2.8 billion in funds toward Maine infrastructure projects. Here’s how they break down:
    – Transportation: 54.7% (Mostly in roads, bridges, and major projects)
    – Clean energy, buildings, and manufacturing: 11.6%
    – Broadband internet: 13.2%
    – Clean water: 9.5%
    – Resilience: 2.7%
    – Environmental remediation: 4.3%
    – Climate-smart agriculture: 0.1%
    – Parks and conservation: 0.1%
    – Other: 3.9%

    Sean Pavone // Shutterstock

    Maryland

    The federal government has announced $13.3 billion in funds toward Maryland infrastructure projects. Here’s how they break down:
    – Transportation: 86.9% (Mostly in passenger and freight rail)
    – Clean energy, buildings, and manufacturing: 2.9%
    – Broadband internet: 3.5%
    – Clean water: 3.6%
    – Resilience: 1.7%
    – Environmental remediation: 0.7%
    – Climate-smart agriculture: 0.3%
    – Parks and conservation: 0.3%
    – Other: 0.2%

    Sean Pavone // Shutterstock

    Massachusetts

    The federal government has announced $8.9 billion in funds toward Massachusetts infrastructure projects. Here’s how they break down:
    – Transportation: 71.5% (Mostly in roads, bridges, and major projects)
    – Clean energy, buildings, and manufacturing: 8.7%
    – Broadband internet: 4.3%
    – Clean water: 7.0%
    – Resilience: 1.6%
    – Environmental remediation: 5.9%
    – Climate-smart agriculture: 0.0%
    – Parks and conservation: 0.5%
    – Other: 0.3%

    Sean Pavone // Shutterstock

    Michigan

    The federal government has announced $12.3 billion in funds toward Michigan infrastructure projects. Here’s how they break down:
    – Transportation: 63.3% (Mostly in roads, bridges, and major projects)
    – Clean energy, buildings, and manufacturing: 8.1%
    – Broadband internet: 18.3%
    – Clean water: 6.4%
    – Resilience: 2.4%
    – Environmental remediation: 0.7%
    – Climate-smart agriculture: 0.3%
    – Parks and conservation: 0.4%
    – Other: 0.2%

    Canva

    Minnesota

    The federal government has announced $7.5 billion in funds toward Minnesota infrastructure projects. Here’s how they break down:
    – Transportation: 61.9% (Mostly in roads, bridges, and major projects)
    – Clean energy, buildings, and manufacturing: 13.0%
    – Broadband internet: 11.8%
    – Clean water: 7.7%
    – Resilience: 1.8%
    – Environmental remediation: 1.0%
    – Climate-smart agriculture: 0.5%
    – Parks and conservation: 0.5%
    – Other: 1.8%

    Canva

    Mississippi

    The federal government has announced $5.5 billion in funds toward Mississippi infrastructure projects. Here’s how they break down:
    – Transportation: 49.8% (Mostly in roads, bridges, and major projects)
    – Clean energy, buildings, and manufacturing: 6.4%
    – Broadband internet: 26.0%
    – Clean water: 5.3%
    – Resilience: 9.4%
    – Environmental remediation: 1.3%
    – Climate-smart agriculture: 0.7%
    – Parks and conservation: 0.5%
    – Other: 0.7%

    TommyBrison // Shutterstock

    Missouri

    The federal government has announced $9.3 billion in funds toward Missouri infrastructure projects. Here’s how they break down:
    – Transportation: 57.5% (Mostly in roads, bridges, and major projects)
    – Clean energy, buildings, and manufacturing: 9.5%
    – Broadband internet: 23.2%
    – Clean water: 5.5%
    – Resilience: 2.1%
    – Environmental remediation: 1.5%
    – Climate-smart agriculture: 0.2%
    – Parks and conservation: 0.2%
    – Other: 0.2%

    Mihai_Andritoiu // Shutterstock

    Montana

    The federal government has announced $6.1 billion in funds toward Montana infrastructure projects. Here’s how they break down:
    – Transportation: 41.0% (Mostly in roads, bridges, and major projects)
    – Clean energy, buildings, and manufacturing: 3.6%
    – Broadband internet: 12.8%
    – Clean water: 33.6%
    – Resilience: 4.8%
    – Environmental remediation: 3.0%
    – Climate-smart agriculture: 0.4%
    – Parks and conservation: 0.6%
    – Other: 0.2%

    Katherine Welles // Shutterstock

    Nebraska

    The federal government has announced $3.0 billion in funds toward Nebraska infrastructure projects. Here’s how they break down:
    – Transportation: 57.1% (Mostly in roads, bridges, and major projects)
    – Clean energy, buildings, and manufacturing: 9.5%
    – Broadband internet: 17.1%
    – Clean water: 8.8%
    – Resilience: 4.1%
    – Environmental remediation: 2.2%
    – Climate-smart agriculture: 0.5%
    – Parks and conservation: 0.8%
    – Other: 0.1%

    randy andy // Shutterstock

    Nevada

    The federal government has announced $4.2 billion in funds toward Nevada infrastructure projects. Here’s how they break down:
    – Transportation: 59.9% (Mostly in roads, bridges, and major projects)
    – Clean energy, buildings, and manufacturing: 9.1%
    – Broadband internet: 15.7%
    – Clean water: 7.7%
    – Resilience: 3.3%
    – Environmental remediation: 3.4%
    – Climate-smart agriculture: 0.0%
    – Parks and conservation: 0.7%
    – Other: 0.1%

    Sean Pavone // Shutterstock

    New Hampshire

    The federal government has announced $1.9 billion in funds toward New Hampshire infrastructure projects. Here’s how they break down:
    – Transportation: 54.0% (Mostly in roads, bridges, and major projects)
    – Clean energy, buildings, and manufacturing: 8.3%
    – Broadband internet: 12.4%
    – Clean water: 18.1%
    – Resilience: 3.7%
    – Environmental remediation: 0.9%
    – Climate-smart agriculture: 0.1%
    – Parks and conservation: 0.2%
    – Other: 2.3%

    Mihai_Andritoiu // Shutterstock

    New Jersey

    The federal government has announced $12.3 billion in funds toward New Jersey infrastructure projects. Here’s how they break down:
    – Transportation: 77.3% (Mostly in roads, bridges, and major projects)
    – Clean energy, buildings, and manufacturing: 4.5%
    – Broadband internet: 3.9%
    – Clean water: 6.3%
    – Resilience: 4.2%
    – Environmental remediation: 3.3%
    – Climate-smart agriculture: 0.0%
    – Parks and conservation: 0.3%
    – Other: 0.2%

    Sean Pavone // Shutterstock

    New Mexico

    The federal government has announced $5.8 billion in funds toward New Mexico infrastructure projects. Here’s how they break down:
    – Transportation: 40.9% (Mostly in roads, bridges, and major projects)
    – Clean energy, buildings, and manufacturing: 8.2%
    – Broadband internet: 18.9%
    – Clean water: 21.3%
    – Resilience: 7.7%
    – Environmental remediation: 1.6%
    – Climate-smart agriculture: 0.2%
    – Parks and conservation: 0.6%
    – Other: 0.5%

    Wangkun Jia // Shutterstock

    New York

    The federal government has announced $28.2 billion in funds toward New York infrastructure projects. Here’s how they break down:
    – Transportation: 72.7% (Mostly in roads, bridges, and major projects)
    – Clean energy, buildings, and manufacturing: 5.6%
    – Broadband internet: 6.2%
    – Clean water: 6.0%
    – Resilience: 1.8%
    – Environmental remediation: 2.3%
    – Climate-smart agriculture: 0.0%
    – Parks and conservation: 0.3%
    – Other: 5.0%

    Sharkshock // Shutterstock

    North Carolina

    The federal government has announced $10.3 billion in funds toward North Carolina infrastructure projects. Here’s how they break down:
    – Transportation: 60.7% (Mostly in roads, bridges, and major projects)
    – Clean energy, buildings, and manufacturing: 6.4%
    – Broadband internet: 21.2%
    – Clean water: 6.9%
    – Resilience: 2.2%
    – Environmental remediation: 1.4%
    – Climate-smart agriculture: 0.2%
    – Parks and conservation: 0.5%
    – Other: 0.6%

    Jacob Boomsma // Shutterstock

    North Dakota

    The federal government has announced $3.7 billion in funds toward North Dakota infrastructure projects. Here’s how they break down:
    – Transportation: 40.4% (Mostly in roads, bridges, and major projects)
    – Clean energy, buildings, and manufacturing: 23.3%
    – Broadband internet: 4.7%
    – Clean water: 13.0%
    – Resilience: 16.2%
    – Environmental remediation: 1.9%
    – Climate-smart agriculture: 0.3%
    – Parks and conservation: 0.0%
    – Other: 0.2%

    Canva

    Ohio

    The federal government has announced $13.8 billion in funds toward Ohio infrastructure projects. Here’s how they break down:
    – Transportation: 65.1% (Mostly in roads, bridges, and major projects)
    – Clean energy, buildings, and manufacturing: 10.6%
    – Broadband internet: 11.5%
    – Clean water: 8.7%
    – Resilience: 1.5%
    – Environmental remediation: 2.0%
    – Climate-smart agriculture: 0.0%
    – Parks and conservation: 0.2%
    – Other: 0.2%

    Sean Pavone // Shutterstock

    Oklahoma

    The federal government has announced $6.4 billion in funds toward Oklahoma infrastructure projects. Here’s how they break down:
    – Transportation: 57.4% (Mostly in roads, bridges, and major projects)
    – Clean energy, buildings, and manufacturing: 5.8%
    – Broadband internet: 22.8%
    – Clean water: 7.6%
    – Resilience: 3.1%
    – Environmental remediation: 3.1%
    – Climate-smart agriculture: 0.1%
    – Parks and conservation: 0.1%
    – Other: 0.0%

    Sean Pavone // Shutterstock

    Oregon

    The federal government has announced $6.5 billion in funds toward Oregon infrastructure projects. Here’s how they break down:
    – Transportation: 52.2% (Mostly in roads, bridges, and major projects)
    – Clean energy, buildings, and manufacturing: 9.8%
    – Broadband internet: 13.7%
    – Clean water: 6.9%
    – Resilience: 4.9%
    – Environmental remediation: 8.5%
    – Climate-smart agriculture: 0.3%
    – Parks and conservation: 1.3%
    – Other: 2.5%

    ESB Professional // Shutterstock

    Pennsylvania

    The federal government has announced $18.1 billion in funds toward Pennsylvania infrastructure projects. Here’s how they break down:
    – Transportation: 65.0% (Mostly in roads, bridges, and major projects)
    – Clean energy, buildings, and manufacturing: 6.1%
    – Broadband internet: 9.0%
    – Clean water: 5.8%
    – Resilience: 6.8%
    – Environmental remediation: 6.6%
    – Climate-smart agriculture: 0.1%
    – Parks and conservation: 0.2%
    – Other: 0.2%

    George Wirt // Shutterstock

    Rhode Island

    The federal government has announced $2.5 billion in funds toward Rhode Island infrastructure projects. Here’s how they break down:
    – Transportation: 62.1% (Mostly in roads, bridges, and major projects)
    – Clean energy, buildings, and manufacturing: 8.2%
    – Broadband internet: 6.4%
    – Clean water: 12.0%
    – Resilience: 5.9%
    – Environmental remediation: 0.5%
    – Climate-smart agriculture: 0.0%
    – Parks and conservation: 4.3%
    – Other: 0.7%

    f11photo // Shutterstock

    South Carolina

    The federal government has announced $5.5 billion in funds toward South Carolina infrastructure projects. Here’s how they break down:
    – Transportation: 65.6% (Mostly in roads, bridges, and major projects)
    – Clean energy, buildings, and manufacturing: 8.3%
    – Broadband internet: 15.5%
    – Clean water: 5.8%
    – Resilience: 2.4%
    – Environmental remediation: 0.5%
    – Climate-smart agriculture: 0.1%
    – Parks and conservation: 1.3%
    – Other: 0.4%

    JohnDSmith // Shutterstock

    South Dakota

    The federal government has announced $3.0 billion in funds toward South Dakota infrastructure projects. Here’s how they break down:
    – Transportation: 57.2% (Mostly in roads, bridges, and major projects)
    – Clean energy, buildings, and manufacturing: 5.0%
    – Broadband internet: 8.5%
    – Clean water: 21.3%
    – Resilience: 4.9%
    – Environmental remediation: 0.3%
    – Climate-smart agriculture: 2.5%
    – Parks and conservation: 0.2%
    – Other: 0.1%

    Kevin Ruck // Shutterstock

    Tennessee

    The federal government has announced $7.9 billion in funds toward Tennessee infrastructure projects. Here’s how they break down:
    – Transportation: 59.7% (Mostly in roads, bridges, and major projects)
    – Clean energy, buildings, and manufacturing: 15.0%
    – Broadband internet: 14.1%
    – Clean water: 6.5%
    – Resilience: 1.8%
    – Environmental remediation: 1.5%
    – Climate-smart agriculture: 0.3%
    – Parks and conservation: 0.3%
    – Other: 0.8%

    Sean Pavone // Shutterstock

    Texas

    The federal government has announced $35.0 billion in funds toward Texas infrastructure projects. Here’s how they break down:
    – Transportation: 59.9% (Mostly in roads, bridges, and major projects)
    – Clean energy, buildings, and manufacturing: 16.7%
    – Broadband internet: 13.1%
    – Clean water: 4.5%
    – Resilience: 3.6%
    – Environmental remediation: 1.5%
    – Climate-smart agriculture: 0.3%
    – Parks and conservation: 0.2%
    – Other: 0.2%

    Sean Pavone // Shutterstock

    Utah

    The federal government has announced $4.8 billion in funds toward Utah infrastructure projects. Here’s how they break down:
    – Transportation: 60.6% (Mostly in roads, bridges, and major projects)
    – Clean energy, buildings, and manufacturing: 7.0%
    – Broadband internet: 8.0%
    – Clean water: 14.9%
    – Resilience: 3.8%
    – Environmental remediation: 3.0%
    – Climate-smart agriculture: 0.9%
    – Parks and conservation: 1.7%
    – Other: 0.1%

    Albert Pego // Shutterstock

    Vermont

    The federal government has announced $2.3 billion in funds toward Vermont infrastructure projects. Here’s how they break down:
    – Transportation: 50.7% (Mostly in roads, bridges, and major projects)
    – Clean energy, buildings, and manufacturing: 12.7%
    – Broadband internet: 10.8%
    – Clean water: 10.0%
    – Resilience: 3.7%
    – Environmental remediation: 4.7%
    – Climate-smart agriculture: 1.3%
    – Parks and conservation: 0.4%
    – Other: 5.8%

    Sean Pavone // Shutterstock

    Virginia

    The federal government has announced $11.2 billion in funds toward Virginia infrastructure projects. Here’s how they break down:
    – Transportation: 63.9% (Mostly in roads, bridges, and major projects)
    – Clean energy, buildings, and manufacturing: 8.0%
    – Broadband internet: 16.2%
    – Clean water: 4.1%
    – Resilience: 5.9%
    – Environmental remediation: 1.2%
    – Climate-smart agriculture: 0.2%
    – Parks and conservation: 0.3%
    – Other: 0.3%

    Agnieszka Gaul // Shutterstock

    Washington

    The federal government has announced $10.3 billion in funds toward Washington infrastructure projects. Here’s how they break down:
    – Transportation: 59.2% (Mostly in roads, bridges, and major projects)
    – Clean energy, buildings, and manufacturing: 8.5%
    – Broadband internet: 15.2%
    – Clean water: 6.2%
    – Resilience: 6.9%
    – Environmental remediation: 1.5%
    – Climate-smart agriculture: 0.2%
    – Parks and conservation: 0.7%
    – Other: 1.5%

    Sean Pavone // Shutterstock

    West Virginia

    The federal government has announced $5.5 billion in funds toward West Virginia infrastructure projects. Here’s how they break down:
    – Transportation: 47.3% (Mostly in roads, bridges, and major projects)
    – Clean energy, buildings, and manufacturing: 8.6%
    – Broadband internet: 24.1%
    – Clean water: 5.6%
    – Resilience: 2.1%
    – Environmental remediation: 11.5%
    – Climate-smart agriculture: 0.0%
    – Parks and conservation: 0.1%
    – Other: 0.6%

    Mihai_Andritoiu // Shutterstock

    Wisconsin

    The federal government has announced $7.2 billion in funds toward Wisconsin infrastructure projects. Here’s how they break down:
    – Transportation: 57.0% (Mostly in roads, bridges, and major projects)
    – Clean energy, buildings, and manufacturing: 6.7%
    – Broadband internet: 19.4%
    – Clean water: 13.0%
    – Resilience: 2.0%
    – Environmental remediation: 1.0%
    – Climate-smart agriculture: 0.4%
    – Parks and conservation: 0.3%
    – Other: 0.3%

    LBill45 // Shutterstock

    Wyoming

    The federal government has announced $4.1 billion in funds toward Wyoming infrastructure projects. Here’s how they break down:
    – Transportation: 34.2% (Mostly in roads, bridges, and major projects)
    – Clean energy, buildings, and manufacturing: 44.4%
    – Broadband internet: 9.1%
    – Clean water: 7.6%
    – Resilience: 1.8%
    – Environmental remediation: 2.1%
    – Climate-smart agriculture: 0.1%
    – Parks and conservation: 0.6%
    – Other: 0.1%

    FIND DAILY, WEEKLY, AND MONTHLY TRUCK PARKING

    On the road and looking for a daily truck parking space? Operated by truckers, we source the best parking spots across the nation to ease your trip planning.

    Story editing by Alizah Salario. Additional editing by Kelly Glass. Copy editing by Tim Bruns.

    Written by: Paxtyn Merten

  • Why Are So Many Trucks Parked on the Side of the Road?

    Why Are So Many Trucks Parked on the Side of the Road?

    semi-truck nevada highway

    Picture yourself driving along a desolate freeway in Washington when suddenly you spot long stretches of trucks in front of you. So, why do trucks pull over on the highway? In this blog, we are going to analyze why there is an increase in the parking of semi trucks on the highway and give some recommendations regarding the same.

    Reasons for Trucks Being Parked on the Side of the Road

    Rest Breaks

    It is compulsory that truck drivers take rest breaks to combat fatigue, which could lead to accidents, and ensure traffic safety. The lack of convenient rest areas often forces drivers to park by the roadside, thereby interrupting traffic flow and making accidents imminent.

    Vehicle Maintenance

    Like any other automobile, trucks need regular servicing and occasional repairs if mechanical problems occur while on the highways; truckers are compelled to park their vehicles aside until they are fixed.

    Weather Conditions

    Extreme weather situations can leave truck drivers stranded on roadsides. Harsh storms, heavy snowfalls, or even flooded roads may make it difficult or, rather, impossible for trucks to proceed with their journey.

    Traffic Congestion

    Truck drivers operating in areas with high traffic congestion or during rush hours may have to park their vehicles temporarily on the side of the road. This move aims to prevent further gridlock and ensure a better flow of traffic.

    Security Dangers

    Safety is everything when it comes to truck drivers. If they encounter dangerous situations like fire, spillage, or sudden breakdown while driving, parking by the roadside is their only way out to protect themselves and other road users.

    Parking Rules

    Sometimes, municipal authorities set up guidelines that truck drivers must observe when parking. They may be required to park for mandatory rest periods or comply with specific loading and unloading time slots, leading to many parked trucks on the side of the road.

    Limited Number of Parking Spaces

    The most significant reason is probably the limited parking lots available. With a growing number of trucks on our highways but without enough purpose-built rest parks, finding suitable parking has become difficult for lorry operators, who often resort to stopping by roadsides.

    What Are the Impacts of Parked Trucks on People?

    Parked trucks have been considered a significant contributing factor to traffic congestion. Their presence forces drivers to detour around them, leading to slower traffic flow, longer travel times, and annoyance for all road users.

    Parked Trucks Safety Hazards

    During nighttime or harsh weather conditions, parked trucks may present serious security risks. Other drivers may fail to notice these immobile vehicles, hence causing accidents that may be fatal or near misses.

    Problem of Environmental Temperament

    Parking along the roadside causes various environmental problems due to the continuous idling of the engines. The burning of unnecessary diesel fuels leads to pollution and other harmful effects on the environment. In addition there could be truck driver consequences of shoulder parking.

    Possible Solutions

    Build More Rest Areas

    Investing in purpose-built rest stops along major highways would address the underlying problem. Large enough parking spaces, as well as amenities and facilities, would encourage lorry drivers to take their obligatory rest breaks at appointed places rather than stopping by at roadsides. 

    Projects such as Truck Parking Club (TPC) have proven effective from Arkansas to the coasts and beyond. TPC provides secure parking solutions for truck drivers across numerous states, addressing the nationwide shortage of rest areas.

    Enhancing Truck Parking Infrastructures

    To accommodate more trucks, the existing truck stops and parking lots could be improved and expanded. These improvements include good lighting, security systems, and surveillance that can create safer spaces for legal parking instead of truckers parking on the roadside.

    Increase in the Enforcement of Parking Regulations

    Regulatory authorities should prioritize the enforcement of the current parking regulations to ensure that areas are safe and compliant for drivers. Normal patrols, heavy penalties against defaulters, and sensitization campaigns will help deter illegal parking while encouraging responsible conduct with respect to truck parking.

    To Summarize

    It may be perplexing to see many trucks parked on the side of the road, but it is important to know why this happens. Breaks, car maintenance, weather conditions, traffic flow, safety dangers, parking laws, and limited availability are all contributing factors. Check out TPC’s parking facilities, which improve the safety and efficiency of truckers’ trips. If you want to become a property partner at TPC, become a property member today.

    The information published herein is for general informational purposes only. Truck Parking Club does not make any representations or warranties about the completeness, reliability, legality, and accuracy of this information. Any reliance placed on such material is strictly at the user’s own risk. Truck Parking Club shall not be responsible for any losses or damages incurred in connection with the information published herein.

  • What State Has the Most Truck Parking?

    What State Has the Most Truck Parking?

    illustration of United States

    Would it be a little too dramatic to suggest a lack of truck parking spaces is decimating the transport industry? Probably, but we wouldn’t be too far off the mark with that assertion. With only 300K spaces provided for three million trucks – equating to a single parking space for every 10 drivers – the truck parking crisis is an intense issue.

    The ramifications are serious. Due to a tightening of driver regulations over the last decade or so, along with an increase in trucks and a decrease in spaces, drivers are wasting endless hours each week hunting for spots that simply do not exist. In the worst case, they are resorting to parking on unsafe abandoned properties and dangerous ramps.

    While no state is spared from the issue, some fare better than others. But which states in particular are considered better or worse for truck parking? Through this short blog post, we shall take a look, starting with the more fortunate of the group.

    States with the Most Truck Parking

    At the risk of stating the obvious, convenient truck parking is essential for drivers, especially when long-haul trips require overnight stays or conformance to the DOT HOS regulations.

    Based on recent data, some states perform better than others when it comes to truck parking spaces, making them more accommodating for drivers.

    • North Dakota: North Dakota truck parking ranks high when it comes to available spaces. With vast open spaces and a lower population density, this state provides plenty of options for drivers needing to park, whether for a short break or an overnight stay.
    • South Dakota: Like its northern neighbor, South Dakota also offers a significant number of truck parking spaces. This is particularly beneficial for drivers traveling through the Midwest, where finding a safe and legal place to park is crucial for maintaining hours of service.
    • Michigan: Michigan truck parking is also more accessible, particularly during the day. The state’s commitment to providing truck drivers with ample parking spaces helps ensure that deliveries can be made safely and on time.
    • Nevada: Known for its wide-open highways and less congested areas, Nevada ranks among the states with the most truck parking. This is especially true for truckers traveling between major hubs like Las Vegas and Reno.
    • Florida: Although known as a high-traffic state, there are a considerable number of truck parking spaces in Florida, particularly at night, in comparison to other states. This makes it a key state for truckers moving goods through the southeastern U.S.

    States with the Least Truck Parking

    Conversely, certain states present tougher challenges for truck parking. High population density, strict regulations, and limited space can make finding a parking spot far more stressful than usual. 

    • Massachusetts: With its dense population and limited land area, Massachusetts is one of the most challenging states for truck parking. Drivers often struggle to find spaces, particularly during peak hours, leading to crowded rest areas and increased competition for spots.
    • New Jersey: Similar to Massachusetts, New Jersey truck parking is more difficult due to the high population density. The state’s infrastructure, designed for a different era, struggles to accommodate the large number of trucks on the road today.
    • Washington, D.C.: While not a state, truck parking in Washington, D.C., is notoriously difficult due to the city’s size and strict regulations. Finding a spot that meets the legal requirements for truck parking in Washington, D.C., can be a challenge for even the most seasoned drivers.
    • Boston, Massachusetts: Truck parking in Boston is particularly scarce, with many drivers finding it difficult to secure a spot close to their delivery points. The city’s narrow streets and historic layout add to the complexity of finding legal truck parking.
    • San Francisco and Los Angeles, California: Both San Francisco and Los Angeles are known for their heavy traffic and limited parking options. Truck parking in San Francisco is especially tight due to the city’s dense urban environment, while truck parking in Los Angeles is complicated by the sheer volume of trucks that pass through the area daily.

    Bottom Line: Go Private With Truck Parking Club

    The truck parking situation varies greatly from state to state. While states like North Dakota, South Dakota, and Nevada provide adequate spaces (again, comparatively), others like Massachusetts and New Jersey fall far short of the mark. 

    If you are a truck driver looking for reliable parking options, you should think about using Truck Parking Club to find convenient, affordable, comfortable truck parking. Our platform offers an easy way to find truck parking spaces, whether you’re in a state with plenty of options or struggling to find a spot in more congested areas.

    Sign up today and secure your parking space with ease!

    The information published herein is for general informational purposes only. Truck Parking Club does not make any representations or warranties about the completeness, reliability, legality, and accuracy of this information. Any reliance placed on such material is strictly at the user’s own risk. Truck Parking Club shall not be responsible for any losses or damages incurred in connection with the information published herein.

  • The most dangerous cities to drive in America

    The most dangerous cities to drive in America

    Two crashed cars and an orange traffic cone on a city street at night.
    Bilanol // Shutterstock

    FIND DAILY TRUCK PARKING IN NEARLY EVERY STATE

    On the road and looking for a daily truck parking space? Find the closest daily parking spot in a

    matter of seconds.

    The most dangerous cities to drive in America

    More than 42,000 Americans died in car crashes in 2022, making these accidents a leading cause of death in the U.S.

    These deaths occurred during over 39,000 crashes that year—about one crash per 10,000 U.S. residents, according to National Highway Traffic Safety Administration tallies. But in some cities, the roads are even more deadly.

    Truck Parking Club used data from the National Highway Traffic Safety Administration to rank the 25 cities with the highest accident rates, measured as accidents per 10,000 residents in 2022. Only cities with at least 10 fatal crashes and 20,000 residents were included in the analysis. Cities without available Census Bureau population estimates were not included.

    Fatal car crash rates fell for several decades as federal and state governments adopted safety regulations for vehicle manufacturers and occupants. But rates went up in 2020 and 2021, with increases in fatalities related to alcohol and speeding. When COVID-19 restrictions decreased the number of cars on the road, many drivers adopted risky driving behaviors that have persisted even as traffic returned to normal. While fatalities decreased in 2022, they remain higher than they’ve been in over a decade.

    Nearly all of the top 25 cities for fatal crashes were in the Southeast. Most were smaller cities: Over half had populations of fewer than 50,000, while only three had more than 100,000 residents. They also tended to be far from major cities. Geographic hazards exist in most, including hilly terrain, winding rivers, and dense forests. Nearly all have some type of waterfront—rivers, lakes, coasts, and the like—which are likely to pose distractions for drivers taking in the view.

    About half of the deadliest cities ranked here are in Georgia—nearly half of which sit within the Atlanta metro area. Though these may be considered suburbs of Atlanta, most are far from the city’s downtown. Few are serviced by Atlanta’s public transit systems, meaning anyone commuting to the city will almost certainly drive for at least part of their trip. In addition, Atlanta ranks as one of the worst highest-populated cities to drive in, according to a 2024 Forbes analysis. These factors add to the risk of accidents.

    Overall, Georgia ranks #14 in traffic fatalities per capita. Georgia Department of Transportation data suggests this is due to speeding, aggressive driving, and people not using seatbelts. Efforts are underway to minimize Georgia’s traffic deaths. The state’s transportation department received a $2.5 million grant to mitigate and decrease crashes, funding car seat distribution, crash data analysis, and education efforts for drivers over 55. Atlanta’s Emory University and Grady Health System also received $4.4 million to study crashes in the metro area and research ways to reduce crashes.

    Still, Georgia isn’t the full story. There were high-ranking cities for traffic fatalities in most U.S. regions. Read on to learn where.

    Aerial view of Downtown Hot Springs.
    Jacob Boomsma // Shutterstock

    #25. Hot Springs, Arkansas

    – Fatal accidents per 10,000 residents: 2.6 (2.2x the national average)
    – Total fatal accidents: 10 (11 fatalities)
    – Most common crash site: U.S. highways (5 fatal accidents)

    A Fort Myers city street lined with palm trees on a sunny day.
    Kristi Blokhin // Shutterstock

    #24. Fort Myers, Florida

    – Fatal accidents per 10,000 residents: 2.7 (2.3x the national average)
    – Total fatal accidents: 26 (29 fatalities)
    – Most common crash site: State highways (11 fatal accidents)

    Strand Historic District with a docked Carnival cruise ship in the background.
    JHVEPhoto // Shutterstock

    #23. Galveston, Texas

    – Fatal accidents per 10,000 residents: 2.8 (2.4x the national average)
    – Total fatal accidents: 15 (19 fatalities)
    – Most common crash site: Local city streets (7 fatal accidents)

    Aerial shot of downtown Albany.
    airwayphoto // Shutterstock

    #22. Albany, Georgia

    – Fatal accidents per 10,000 residents: 2.8 (2.4x the national average)
    – Total fatal accidents: 19 (19 fatalities)
    – Most common crash site: State highways (8 fatal accidents)

    Views along Beachfront Avenue in Fort Lauderdale.
    Todamo // Shutterstock

    #21. Fort Lauderdale, Florida

    – Fatal accidents per 10,000 residents: 2.9 (2.5x the national average)
    – Total fatal accidents: 53 (54 fatalities)
    – Most common crash site: U.S. highways (15 fatal accidents)

    Macon, Georgia, downtown cityscape from a high angle.
    Sean Pavone // Shutterstock

    #20. Macon, Georgia

    – Fatal accidents per 10,000 residents: 2.9 (2.5x the national average)
    – Total fatal accidents: 46 (51 fatalities)
    – Most common crash site: State highways (21 fatal accidents)

    Ocala Marion County Veteran's Memorial Park.
    Sunshower Shots // Shutterstock

    #19. Ocala, Florida

    – Fatal accidents per 10,000 residents: 3.1 (2.6x the national average)
    – Total fatal accidents: 20 (20 fatalities)
    – Most common crash site: State highways (6 fatal accidents)

    Elizabethtown historic masonic temple building in the townscape.
    Sabrina Janelle Gordon // Shutterstock

    #18. Elizabethtown, Kentucky

    – Fatal accidents per 10,000 residents: 3.1 (2.7x the national average)
    – Total fatal accidents: 10 (10 fatalities)
    – Most common crash site: U.S. highways (4 fatal accidents)

    La Grange historic mansion on a sunny morning.
    Sabrina Janelle Gordon // Shutterstock

    #17. LaGrange, Georgia

    – Fatal accidents per 10,000 residents: 3.1 (2.7x the national average)
    – Total fatal accidents: 10 (12 fatalities)
    – Most common crash site: State highways (5 fatal accidents)

    Aerial view of city of Rome, Georgia.
    RodClementPhotography // Shutterstock

    #16. Rome, Georgia

    – Fatal accidents per 10,000 residents: 3.2 (2.7x the national average)
    – Total fatal accidents: 12 (12 fatalities)
    – Most common crash site: State highways (7 fatal accidents)

    A quiet Morristown historical district street.
    Dee Browning // Shutterstock

    #15. Morristown, Tennessee

    – Fatal accidents per 10,000 residents: 3.2 (2.7x the national average)
    – Total fatal accidents: 10 (10 fatalities)
    – Most common crash site: U.S. highways (4 fatal accidents)

    A sign on an elevated catwalk going over a street that reads, Thank you for visiting Daytona Beach.
    Nick Fox // Shutterstock

    #14. Daytona Beach, Florida

    – Fatal accidents per 10,000 residents: 3.2 (2.7x the national average)
    – Total fatal accidents: 25 (25 fatalities)
    – Most common crash site: Local city streets (10 fatal accidents)

    Aerial view of the Atlanta Outer Ring suburb of Lawrenceville, Georgia.
    Jacob Boomsma // Shutterstock

    PREVIOUSLY INACCESSIBLE TRUCK PARKING

    Take care of your truck and trailer parking needs with new locations added daily. 

    #13. Lawrenceville, Georgia

    – Fatal accidents per 10,000 residents: 3.3 (2.8x the national average)
    – Total fatal accidents: 10 (10 fatalities)
    – Most common crash site: State highways (4 fatal accidents)

    Panoramic view of Memphis, Tennessee, with the elevated Hernando de Soto bridge over the Mississippi River.
    Steve Heap // Shutterstock

    #12. Memphis, Tennessee

    – Fatal accidents per 10,000 residents: 3.3 (2.8x the national average)
    – Total fatal accidents: 207 (228 fatalities)
    – Most common crash site: Local city streets (111 fatal accidents)

    Aerial view of Downtown Flint, Michigan, in summer.
    Jacob Boomsma // Shutterstock

    #11. Flint, Michigan

    – Fatal accidents per 10,000 residents: 3.5 (3.0x the national average)
    – Total fatal accidents: 28 (28 fatalities)
    – Most common crash site: Local city streets (24 fatal accidents)

    A sign over a street that reads, thanks for visiting Kingman, Arizona, Historic Downtown, with a Heart of Route 66 emblem.
    Christophe KLEBERT // Shutterstock

    #10. Kingman, Arizona

    – Fatal accidents per 10,000 residents: 3.7 (3.2x the national average)
    – Total fatal accidents: 13 (16 fatalities)
    – Most common crash site: State highways (3 fatal accidents)

    An aerial view of an event with canopy tents set up in Stockbridge, Georgia.
    Christopher V Jones // Shutterstock

    #9. Stockbridge, Georgia

    – Fatal accidents per 10,000 residents: 3.9 (3.3x the national average)
    – Total fatal accidents: 14 (14 fatalities)
    – Most common crash site: Interstates (5 fatal accidents)

    A large water tank that reads, Gainesville, Georgia, poultry capital of the world.
    EQRoy // Shutterstock

    #8. Gainesville, Georgia

    – Fatal accidents per 10,000 residents: 4.0 (3.4x the national average)
    – Total fatal accidents: 18 (19 fatalities)
    – Most common crash site: State highways (14 fatal accidents)

    The old third ward school in Griffin, Georgia.
    Georges_Creations // Shutterstock

    #7. Griffin, Georgia

    – Fatal accidents per 10,000 residents: 4.2 (3.6x the national average)
    – Total fatal accidents: 10 (10 fatalities)
    – Most common crash site: State highways (7 fatal accidents)

    A view of the front of a Bank of America building.
    Lee Reese // Shutterstock

    #6. Mcdonough, Georgia

    – Fatal accidents per 10,000 residents: 4.3 (3.6x the national average)
    – Total fatal accidents: 13 (16 fatalities)
    – Most common crash site: Local township streets (3 fatal accidents)

    Aerial view of the Atlanta suburb of Marietta, Georgia.
    Jacob Boomsma // Shutterstock

    #5. Marietta, Georgia

    – Fatal accidents per 10,000 residents: 4.6 (3.9x the national average)
    – Total fatal accidents: 29 (29 fatalities)
    – Most common crash site: State highways (7 fatal accidents)

    An aerial view of Decatur Square in Decatur, Georgia, during fall.
    Marcus E Jones // Shutterstock

    #4. Decatur, Georgia

    – Fatal accidents per 10,000 residents: 4.9 (4.2x the national average)
    – Total fatal accidents: 12 (14 fatalities)
    – Most common crash site: County roads (6 fatal accidents)

    Port Lagoon streets and buildings at night.
    GagliardiPhotography // Shutterstock

    #3. Panama City, Florida

    – Fatal accidents per 10,000 residents: 5.2 (4.4x the national average)
    – Total fatal accidents: 18 (19 fatalities)
    – Most common crash site: U.S. highways (7 fatal accidents)

    Aerial shot of a rural road in Georgia.
    RodClementPhotography // Shutterstock

    #2. Cartersville, Georgia

    – Fatal accidents per 10,000 residents: 5.9 (5.0x the national average)
    – Total fatal accidents: 14 (15 fatalities)
    – Most common crash site: State highways (8 fatal accidents)

    Aerial view of the Long Island's south coast.
    Alexandr Junek Imaging // Shutterstock

    FIND DAILY, WEEKLY, AND MONTHLY TRUCK PARKING

    On the road and looking for a daily truck parking space? Operated by truckers, we source the best parking spots across the nation to ease your trip planning.

    #1. Hempstead, New York

    – Fatal accidents per 10,000 residents: 6.0 (5.1x the national average)
    – Total fatal accidents: 35 (35 fatalities)
    – Most common crash site: State highways (18 fatal accidents)

    Story editing by Carren Jao. Additional editing by Kelly Glass. Copy editing by Kristen Wegrzyn. Photo selection by Clarese Moller.

    Written by: Paxtyn Merten

  • How Much Space Do Trucks Need?

    How Much Space Do Trucks Need?

    big semi-truck

    One of the most important aspects of logistics is efficient truck transportation. For this reason, it is necessary to understand the spatial requirements of trucks prior to designing and planning for parking facilities. Besides safety concerns, trucks need spacious areas for their operations to be effective. This blog explores the realm of truck parking and looks at how much space will be enough for a single truck.

    Understanding Parking Spot Dimensions For Trucks

    The dimensions of the parking spaces are critical in designing facilities for semi-trailer parking and commercial truck parking lots, as they ensure the functionality and safety of the lot. The sizes of these parks have a significant impact on how trucks move about or stop, which makes it necessary to consider the specific width or length requirements of these vehicles.

    The first thing to consider is that the parking slot in a commercial truck parking lot must be wide enough. Trucks, such as semi-trailers, need to have enough width to enter and leave their respective slots comfortably. The minimum space needed is 15 feet, which accommodates the measurement of most trucks and trailers, leaving enough distance on each side. This makes it easy to park and also reduces the chances of accidentally hitting other vehicles.

    The length of parking spaces is equally significant as their widths for catering to the different sizes of trucks. Various commercial trucks have a variety of lengths, ranging from basic tractor-trailer configurations to long combination vehicles. The length of a parking space ideal for a truck normally ranges between 30 and 40 feet. The range accommodates different sizes of trucks that are usually found in commercial motor freight, therefore ensuring that various trucks have enough space to park and maneuver within a parking area.

    Truck Parking Club (TPC) has parking lots that enable efficient truck operation. This is due to the presence of enough space that allows drivers to turn their trucks safely without congesting the parking area. Additionally, it ensures a secure environment for truck drivers as well as other users of such parking lots.

    Different Trucks’ Space Requirements

    Trucks are the transportation industry workhorses, and they require different spatial considerations in terms of parking and maneuvering, whether in Arkansas or Iowa. One type of truck that is commonly encountered is a semi-trailer, which consists of a truck cab and a trailer meant for carrying goods. In this regard, you should be interested in knowing how much space these semi-trailers need to make good parking facilities.

    A typical semi-trailer requires quite a bit of storage space. For purposes of parking and storage provision, the trailer alone should be allocated an area measuring 55 feet long by 14 feet wide, considering its length and width measurements. This space is designed to ensure that no trailers can block other users or pose risks within the parking lot. It also allows for smooth movement and ease of offloading operations.

    When accommodating the truck and trailer, a larger space measuring 75 ft by 14 ft should be provided. This takes into consideration the overall length of the truck plus that of the trailer. It provides enough room for parking and nose swinging (maneuvering). The extra length helps align properly with one another on any given plot, thus minimizing damage risk and ensuring safe operation inside the facility.

    Further Considerations

    Apart from providing sufficient space for trucks, parking facilities must also meet trucker’s requirements. It means setting aside areas where drivers can park their trucks while resting. The lot should also provide conditions for safe and comfortable resting. In addition, drivers need about 100 feet of clearance behind them when they back out of a parking place.

    During turning maneuvers, a medium-sized semi-truck making a 180-degree turn requires an outer turning radius of at least 40 feet. This is significant since it promotes smooth vehicle operations and reduces any risks faced during maneuvering.

    To Summarize

    Understanding the spatial requirements of trucks is essential for designing efficient and safe parking facilities in the logistics industry. By providing adequate space for various types of trucks, considering factors like backing space and turning radius, and accommodating the needs of truck drivers, parking facilities can enhance operational efficiency and safety. 

    Incorporating these dimensions and requirements ensures that truck parking spaces are optimized for the smooth flow of operations and contributes to a more productive and organized trucking environment. Look for parking lots from TPC to ensure your truck has the space it needs. You can also become a property member and help truck drivers find the best space for their trucks, regardless of size.

    The information published herein is for general informational purposes only. Truck Parking Club does not make any representations or warranties about the completeness, reliability, legality, and accuracy of this information. Any reliance placed on such material is strictly at the user’s own risk. Truck Parking Club shall not be responsible for any losses or damages incurred in connection with the information published herein.

  • How Many Trucks Can Be Parked in an Acre?

    How Many Trucks Can Be Parked in an Acre?

    Row of semi trucks lined up at dusk in a truck stop parking area

    The trucking industry depends on a network of parking areas to keep drivers safe and deliveries on schedule. So, the question is, how many parking spaces per acre? By maximizing parking space utilization, the total logistics process can be improved.

    Factors Affecting Parking Space Utilization

    Layout And Design

    The layout and design of a truck parking area greatly determine the number of trucks that can fit on a given acreage. Different types of parking layouts, such as angle, perpendicular, and parallel parking, have varying benefits and factors to consider when designing for efficiency in space use.

    Angle Parking

    Angle parking is a common choice for truck parks due to its balance between compactness and maneuverability. Trucks are parked at an angle with respect to the driving aisle so as to provide greater visibility when entering or leaving the lot. Parking lot planners achieve great numbers on limited spaces while keeping drivers safe by using this kind of approach.

    Perpendicular Parking

    Parking trucks at right angles to the drive-throughs is referred to as perpendicular parking. This design allows for more truck parking, but drivers may need more expertise and precision when they want to park or even go out. This system can further hinder truck maneuvering, especially in limited spaces.

    Parallel Parking

    Linear or elongated truck parking areas usually employ parallel parking. This permits a higher concentration of trucks parked in a straight line, thereby making the best use of space. Nevertheless, compared to angle or perpendicular layouts, parallel parking has a balanced trade-off between maximizing space and maneuverability but can be less efficient in accommodating the largest number of trucks.

    Type and Size of Trucks

    What sort and size of tracks determine how many cars can fit within a truck car park? Different types, such as semi-trailers, box trucks, or flatbeds, have various sizes and spatial requirements that affect the total capacity within a compound.

    Semi-trailers are the largest trucks in truck parking. Since they are long and tall, you need to ensure there are enough parking spaces per acre to accommodate both the cab and trailer units.

    The design of a parking facility intended to hold semi-trailers must include provisions for the turning radius, maneuvering space, and overall dimensions of these types of vehicles so that the maximum number of parking spaces can be achieved.

    Box Trucks

    Compared with semi-trailers, box trucks are smaller but still require adequate parking space and room for maneuvering. Thus, during the planning stage of a truck parking layout, one also has to take into account the size of the truck, in terms of length or height, so that the available land resource is used well.

    Flatbed Trucks

    Parking flatbeds differ from other types because they have an open motor home freight carrier. Parking lots meant for flatbeds must have accommodations at the rear end that cater to this feature while allowing drivers safe access to their parked cars.

    To ensure that there is sufficient parking space available within a truck lot, one needs to optimize flatbed trailer lengths along with widths and clearance requirements.

    Determining How Many Trucks Can Fit on a Square Acre

    Calculation of Available Parking Space: The size and shape of an acre can greatly affect the number of trucks it can hold, yet estimates usually range from 34 to 40 trailers per acre without considering the truck’s cab.

    • A bare-bones lot with minimal amenities and tight spacing might fit up to 40 trucks per acre.
    • A more spacious layout with lots of amenities might only accommodate 15-20 trucks per acre.

    When planning a truck parking area, it’s best to balance maximum capacity with driver safety, comfort, and regulatory compliance. While fitting more trucks per acre can seem advantageous, it’s often better to aim for a number in the middle of the range to ensure a functional, safe, and driver-friendly parking facility.

    Factors Influencing the Number of Trucks Parked

    • Parking Lot Configuration
    • Size of Vehicles
    • Mixed Vehicle Size
    • Space Used for Additional Amenities
    • Local Regulations

    To Summarize

    Efficient parking space utilization, whether in Iowa or Minnesota, is essential for the trucking industry to streamline operations and ensure the well-being of drivers. By understanding the factors influencing truck parking capacity and implementing best practices, you can maximize the number of trucks parked per acre.

    Become a property member and help increase the number of efficient parking lots across North America.

    If you are a driver, you can sign up as a Truck Member and take advantage of truck parking throughout the USA.

    The information published herein is for general informational purposes only. Truck Parking Club does not make any representations or warranties about the completeness, reliability, legality, and accuracy of this information. Any reliance placed on such material is strictly at the user’s own risk. Truck Parking Club shall not be responsible for any losses or damages incurred in connection with the information published herein.

  • 7 Tips for Enhancing Truck Driver Comfort During Long Hauls

    7 Tips for Enhancing Truck Driver Comfort During Long Hauls

    male driver sitting in his truck, using his tablet

    Long-haul journeys can be physically and mentally taxing on truck drivers. However, with the right strategies and techniques, it’s possible to enhance driver comfort and make these journeys more enjoyable. 

    This article will explore a range of indispensable tips that can drastically improve truck driver comfort during long hauls.

    1. Regular Stops at Parking Lots

    Utilizing parking lots allows drivers to pull over safely and take a break from driving, promoting both physical and mental well-being. 

    Taking advantage of these stops enables drivers to stretch their legs and engage in short walks, helping to alleviate any muscle stiffness or discomfort that may arise from prolonged sitting. 

    It is recommended for drivers to stop every two to three hours for at least 15 to 20 minutes, allowing for necessary physical relief and a mental reset.

    Regular breaks help combat the physical toll of long hours of driving, reducing stiffness and promoting better blood circulation throughout the body. These breaks also contribute to maintaining focus and concentration while on the road, preventing driver fatigue, and enhancing overall attentiveness for safe driving.

    Find available truck parking spots with Truck Parking Club, book in advance, and plan your hauls more efficiently. This will ensure you always have a place to park your rig when on the road. 

    2. Temperature, Posture, and Comfort

    Keeping the truck cabin at a comfortable temperature can prevent excess heat or cold from affecting the driver’s comfort and focus. This is especially true during hot summers, enhancing both the comfort and safety of your journey. 

    Effectively utilizing the truck’s climate control systems can help regulate the temperature within the cabin, ensuring a conducive environment for long drives. Proper ventilation can also play a crucial role in maintaining a comfortable temperature and air quality inside the truck, contributing to driver well-being.

    Maintaining a good seating position with proper back support can prevent backaches and discomfort during extended periods of driving. 

    Ensuring that the truck seats are adjustable can help drivers find the optimal position to support their posture and reduce strain on the back and neck. Keeping feet flat on the floor and using footrests, if available, can help maintain a balanced and ergonomic driving posture.

    Additionally, seats with adequate cushioning and support can significantly enhance comfort and reduce the impact of vibrations and bumps on the road. 

    Using seat cushions or built-in lumbar support can provide additional comfort and prevent lower back pain, a common issue for long-haul drivers. Making small adjustments to the seat, steering wheel, and mirrors can improve overall comfort and reduce strain on the body during long drives.

    3. Ergonomic Seating and Cushioning

    Investing in ergonomic seating and cushioning is vital in ensuring driver comfort during long hauls. 

    High-quality truck seats specifically designed for long-distance driving provide excellent lumbar support, adjustable features, and proper weight distribution to alleviate any discomfort caused by extended periods of sitting. 

    The right combination of support and cushioning can make a remarkable difference in driver comfort.

    4. Proper Body Mechanics and Stretching

    Truck drivers often experience muscle stiffness and backaches due to prolonged sitting and repetitive motions. 

    By implementing proper body mechanics and incorporating stretching exercises into their routine, drivers can reduce muscle tension, increase blood circulation, and improve overall comfort. Simple stretches like shoulder rolls, neck stretches, and leg exercises can be done during rest breaks to alleviate any muscle strains.

    5. Healthy Snacks and Hydration

    Maintaining a healthy diet and staying hydrated is crucial for truck drivers’ comfort and well-being on the road. Packing nutrient-rich snacks, such as fruits, granola bars, and nuts, can provide necessary energy and prevent fatigue. 

    It is equally important to stay hydrated by carrying an adequate water supply and limiting the consumption of sugary drinks or caffeine, which can lead to dehydration or energy crashes.

    6. Mindfulness and Mental Well-being

    Long-haul journeys can be mentally exhausting. Practicing mindfulness techniques, such as deep-breathing exercises and meditation, can help reduce stress, increase focus, and improve overall mental well-being. 

    Relaxation techniques during rest breaks, listening to calming music, or engaging in light reading can also create a more pleasant driving experience.

    7. Comfortable Clothing and Footwear

    Choosing comfortable clothing and footwear can significantly impact driver comfort during long hauls. 

    Opting for breathable materials, loose-fitting attire, and supportive footwear can prevent discomfort caused by restricted movement, excessive sweating, and foot pain. Comfortable clothing and footwear are key to maintaining ease and preventing distractions while on the road.

    Take Care of Your Driving Comfort Today

    Truck drivers face numerous challenges during long hauls, particularly in terms of maintaining comfort and well-being. 

    However, by implementing these expert tips and strategies, drivers can drastically enhance their on-road experience. Remember, prioritizing driver comfort plays a significant role in ensuring a more comfortable journey and improving overall safety and productivity during long hauls. 

    So, embrace these tips, make the necessary adjustments, and enjoy a more relaxed and rewarding experience on the road! For a comfortable ride, make regular stops, ensure proper posture, exercise when possible, maintain a healthy diet, and practice mindfulness. 

    And remember, whenever you find yourself searching for the best spot to park your rig and get a good night’s rest, Truck Parking Club is the primary app connecting truckers and private truck parking owners. 

    BECOME A TRUCKER MEMBER TODAY

    The information published herein is for general informational purposes only. Truck Parking Club does not make any representations or warranties about the completeness, reliability, legality, and accuracy of this information. Any reliance placed on such material is strictly at the user’s own risk. Truck Parking Club shall not be responsible for any losses or damages incurred in connection with the information published herein.

  • Here’s how the rise in e-commerce is impacting America’s truck drivers

    Here’s how the rise in e-commerce is impacting America’s truck drivers

    A large semi-truck driving along a highway in a rural area.
    Vitpho // Shutterstock

    FIND DAILY, WEEKLY, AND MONTHLY TRUCK PARKING

    On the road and looking for a daily truck parking space? Operated by truckers, we source the best parking spots across the nation to ease your trip planning.

    Here’s how the rise in e-commerce is impacting America’s truck drivers

    E-commerce sales eclipsed $1.1 trillion in 2023 and are pacing to climb even higher by the end of this year.

    This surge has direct implications for truckers, who are charged with hauling these goods in large volumes and new ways. Truck Parking Club compiled data from the Census Bureau, Bureau of Labor Statistics, and Freight Analysis Framework to measure the growth in e-commerce and see how the trucking industry has responded.

    Online sales are nabbing increasingly higher shares of overall retail in the U.S., growing from less than 1% of retail in 2000 to 16% midway through 2024, Census Bureau data shows. E-commerce is tightly interconnected with freight hauling and warehousing, essential steps that bring items from a shopper’s online cart to their front door.

    Increasing demand for fast, free delivery spurred by Amazon’s standard-setting shipping times has raised the bar for other online marketplaces and put more pressure on logistics providers. Major transformations are already underway within the industry to be more time- and cost-efficient, including building warehouses more densely, ultimately creating a network of shorter-distance distribution sites.

    As online shopping continues to become embedded into everyday life, the pressure on shipping and transport is unlikely to ease. These are some of the changes that have occurred so far.

    A line chart showing how the trucking industry has grown alongside e-commerce sales from 2017 to 2023. As rapid deliveries become the norm for online retail, local trucking jobs and average earnings for truckers are seeing major growth.

    PREVIOUSLY INACCESSIBLE TRUCK PARKING

    Take care of your truck and trailer parking needs with new locations added daily. 

    As e-commerce has grown rapidly, local trucking jobs, wages see moderate gains

    E-commerce sales have more than doubled since 2017, remaining elevated as new norms took hold amid the COVID-19 pandemic. While many people chose to start shopping online due to lockdown orders and social distancing mandates, most kept these habits even after restrictions eased. In turn, trucking industry earnings and local trucking jobs have grown substantially.

    The most notable transportation industry effect was local freight driver jobs growth. In an e-commerce economy, short-distance truckers are much more necessary as companies store goods in more distributed warehouses rather than a few centralized locations. These roles grew by over 20% from 2017 to 2023—more than three times the overall job growth rate during that period. High volumes of short-distance truckers are critical to ensure the short delivery windows that shoppers have come to expect.

    By comparison, long-haul trucking jobs have grown just 4% since 2017. While long-distance trucking still accounts for over 7 in 10 trucking jobs, local trucking jobs are beginning to claim a higher share of employment. The industry’s changing landscape means many truck drivers can deliver goods closer to home rather than hauling freight to distant states throughout the week, allowing them to spend more time with their families.

    Wages have also grown in recent years. Truckers can now expect to earn over $31 per hour on average, according to the Bureau of Labor and Statistics. Some companies are paying even more to truckers to elevate their e-commerce offerings and stay competitive in a high-demand field. This competition gives truck drivers more options in their job search and more leverage with their employers.

    However, high quotas and package loads can mean long, grueling, and potentially dangerous working environments. Amazon, in particular, has come under fire regularly for overwhelming drivers with package volumes, which allegedly force them to skip breaks, drive recklessly, and use unsafe loading methods that could lead to back injuries. Within these and other challenging work conditions, the trucking industry is struggling to recruit and retain qualified applicants, all while their services are increasingly in demand.

    Under the strain, new delivery technologies are emerging to find efficient ways to fulfill an ever-growing volume of online orders. Some are testing delivery drones, electric vehicles, and autonomous vehicles as solutions, which could eventually affect truck driver jobs available in the future.

    Still, future job prospects are strong for truckers. The BLS projects the economy will add nearly 100,000 jobs between heavy truck drivers and light truck drivers over the next decade, with both occupations expected to grow faster than average among U.S. jobs. As experts project more e-commerce growth, it’s likely these changes will continue to take hold in the American trucking industry.

    FIND DAILY TRUCK PARKING IN NEARLY EVERY STATE

    On the road and looking for a daily truck parking space? Find the closest daily parking spot in a matter of seconds

    Story editing by Carren Jao. Additional editing by Kelly Glass. Copy editing by Kristen Wegrzyn.

    Written by Paxtyn Merten

  • Essential Items for Truck Drivers: Must-Haves on the Road

    Essential Items for Truck Drivers: Must-Haves on the Road

    Trailer trucks driving on the road

    Life on the road for truck drivers can be both challenging and rewarding, filled with long stretches of highway and ever-changing landscapes. 

    To ensure a smooth and comfortable journey, truck drivers must be well-prepared with a range of essential items. From clothing and food supplies to personal care products and emergency tools, having the right gear can make all the difference in a driver’s experience on the open road. 

    This comprehensive guide will highlight the must-have things truck drivers need on the road, emphasizing their importance in enhancing safety, health, and overall well-being during long-haul trips.

    Must-Haves on the Road

    As truck drivers embark on their journeys, whether to Nevada or Alaska, there are several key items that are indispensable for their safety, comfort, and convenience. Here are some essential trucker must-haves on the road:

    Clothing and Accessories

    • Weather-Appropriate Clothing: Truck drivers should have a variety of clothing options to suit different weather conditions. Breathable, moisture-wicking fabrics are ideal for hot climates, while thermal wear and insulating layers are essential for colder months to maintain comfort and regulate body temperature.
    • Functional Footwear: Proper footwear is crucial for truckers who spend extended hours on their feet. Durable boots with slip-resistant soles provide stability and protection, especially when navigating various terrains. Comfortable sneakers or shoes are also important for driving long distances and ensuring driver comfort throughout the journey.
    • Accessories for Comfort and Safety: Truck drivers should equip themselves with accessories that enhance comfort and safety on the road. Protective gloves are essential for handling cargo and equipment, while sunglasses help reduce glare and protect eyes from UV rays. Hats serve a dual purpose by offering protection from the sun and shielding the eyes from glare, ensuring clear visibility while driving.

    Food and Cooking Supplies

    • Compact Refrigerator: A small refrigerator in the truck can help store perishable items like meats, dairy products, and fruits, ensuring access to fresh food on the go.
    • Portable Stove: A portable stove allows truck drivers to cook meals whenever they want, providing a cost-effective alternative to frequent fast food joints.
    • Utensils: Basic kitchen utensils such as a knife, cutting board, pots, and pans are essential for preparing meals conveniently in the truck cabin.
    • Non-Perishable Snacks: Stocking up on items like nuts, granola bars, and dried fruits ensures access to quick and healthy snacks during the journey.
    • Protein Sources: Including protein-rich foods like canned tuna, jerky, or protein bars helps truck drivers stay full and alert on long drives.
    • Fresh Produce: Carrying fresh fruits and vegetables can provide essential nutrients and a refreshing break from packaged foods, contributing to overall health and well-being while on the road.

    Toiletries and Personal Care

    • Hygiene Essentials: Basic personal care kit, shower caddy, wet wipes, and hand sanitizer promote proper hygiene and cleanliness on the road.
    • Medicines and Medical Supplies: First aid kit, routine medication, and vitamins ensure preparedness for any health needs that may arise.

    Sleep Comfort and Tools

    • Bedding and Sleep Comfort: Quality mattresses, pillows, bedding, and sleep-enhancing accessories promote restful sleep during stopovers.
    • Tools and Emergency Equipment: A simple tool kit, road safety gear, and tire pressure gauge equip truck drivers for minor repairs and emergencies on the road.

    Technology and Entertainment

    • Gadgets and Connectivity: Smart devices, mobile hotspots, GPS navigation, and dashcams enhance connectivity and safety during long hauls.
    • Entertainment for Downtime: Audio entertainment, e-readers, gaming consoles, and portable Bluetooth speakers provide relaxation and leisure activities during breaks.

    Take Your Essentials With You!

    Having the right essentials on hand is crucial for truck drivers to easily navigate the challenges of long-haul trips. From clothing and food supplies to personal care products and emergency tools, each item plays a vital role in ensuring safety, comfort, and well-being on the road. 

    When in need of replenishing supplies or taking a break, truck drivers can rely on the amenities available at private parking lots available at the Truck Parking Club app to refuel and recharge before continuing their journey. 

    By prioritizing these must-have items, truck drivers can enjoy a smoother and more rewarding experience on the open road, making their travels more efficient and enjoyable. 

    Remember, whether it’s truckers’ essentials or must-have items for truck drivers, being well-equipped and prepared is key to a successful and memorable journey on the road. 

    And when you find yourself searching for reliable truck parking, be sure to browse our available amenities. Join Truck Parking Club today and take the hassle out of truck parking. 

    BECOME A TRUCKER MEMBER

    The information published herein is for general informational purposes only. Truck Parking Club does not make any representations or warranties about the completeness, reliability, legality, and accuracy of this information. Any reliance placed on such material is strictly at the user’s own risk. Truck Parking Club shall not be responsible for any losses or damages incurred in connection with the information published herein.

  • Essential Guide to Truck Driver Pre/Post-Trip Inspections in Parking Lots

    Essential Guide to Truck Driver Pre/Post-Trip Inspections in Parking Lots

    toolbox for vehicle inspection

    As a truck driver, you will know that safety is a chief aspect of your role. Being in control of a 40-ton vehicle thundering around the highways of America entails a certain amount of responsibility, not least of which is the general condition of the truck you are in control of. 

    After all, a poorly maintained truck equates to a dangerous truck, and a safe journey lies in those seemingly routine pre- and post-trip inspections that you must undertake from time to time. 

    While rigorous, thorough checks are non-negotiable, a good truck driver also knows how to carry out a few essential checks when he or she is on the road.

    For most of you, these checks are baked into your driver DNA, but we figured a little refresher might be helpful for anyone who feels they need it. So, ladies and gents, we bring you the Truck Parking Club guide for pre-and post-trip inspections while parked in one of our property member truck parking lots.

    Pre and Post-Trip Inspections: Why They Matter

    It may be tempting for some (but certainly not all) drivers to become a little relaxed about inspections, but let’s be clear: skipping them is downright dangerous. One or two loose locking nuts or a damaged air hose could spell disaster in the extreme, while a burnt-out tail light could lead to a traffic violation or safety citation during roadside checks.

    Pre- and post-trip inspections are a truck driver’s first line of defense against mechanical failures, safety hazards, and costly delays. By the same token, as a side note for property members, providing a safe, well-maintained lot will play a huge part in attracting and retaining reliable drivers who keep your business thriving.

    What Is a Post Trip Inspection?

    A post-trip inspection is your opportunity to assess any wear and tear that may have occurred during your journey.  Did you hit a particularly nasty pothole?  Notice any strange noises or vibrations?  This is your chance to catch those issues early on before they turn into major problems. What better opportunity than when you are parked up in a Truck Parking Club parking lot?

    The Quick Inspection Checklist

    While a comprehensive inspection is ideal, you are going to lack the tools (or, indeed, the time) to undergo a thorough inspection while parked at a parking lot. Again, this guide is more of a gentle refresher on what you should be looking for when on the road. Let’s take a look.

    1. Tires: Check for proper inflation, tread wear, and damage, such as cuts or bulges. Quick visual inspections can unearth potential problems before they leave you stranded on the side of the road. Underinflated or worn tires not only compromise safety but also affect fuel economy over time.
    1. Lights: Walk around your truck and ensure all lights—headlights, taillights, brake lights, and turn signals—are functioning properly. A burned-out bulb is an easy fix in the lot but a potential nightmare out on the highway (and a potential safety hazard).
    1. Brakes: Run a brief brake test to ensure responsiveness and listen for any unusual noises – if something feels off, it’s obviously better to address it before you hit the road, as compromised brakes can have pretty serious consequences.
    1. Fluids: Quickly check your engine oil, coolant, and washer fluid levels. Top them off if necessary – it’s a small investment that can prevent major problems like engine overheating or compromised visibility.
    1. Mirrors and Windshield: Make sure your mirrors are clean and adjusted properly for ultimate visibility before checking your windshield for cracks or chips that could hinder your vision and become a safety issue.
    1. Cargo Securement: Be double sure that your load is properly secured. Loose cargo can shift during transit, causing a great deal of instability and danger, not to mention damage to the actual cargo.

    What to Check During a Post-Trip Inspection

    A post-trip inspection looks deeper into the condition of your truck after a long haul. Here’s what you should add to your checklist:

    1. Leaks: Check under your truck for any signs of fluid leaks. Oil, coolant, or fuel leaks can indicate serious problems that need immediate attention.
    1. Damage: Look for any new dents, scratches, or other damage that may have occurred during your trip. Addressing these promptly can prevent further deterioration.
    1. Brakes (Detailed): Go further than a basic brake test if you can. Check the air pressure in your brake system and inspect the brake lines for any leaks or wear.
    man holding spanner

    The Benefits of Pre & Post Trip Inspections

    By always performing pre-and post-trip inspections, not only will you comply with regulations, but you will also invest in your safety and long-term success as a truck driver. 

    Regular inspections can help you:

    • Prevent Breakdowns: Identifying and fixing minor issues before they become major problems can save you time and money on the road.
    • Improve Safety: A well-maintained truck is a safer truck, reducing the risk of accidents and injuries.
    • Improve Productivity: Proper maintenance can improve fuel economy and reduce wear and tear, leading to long-term cost savings.
    • Maintain Professionalism: A well-kept truck shows that you take pride in your work and care about the safety of yourself and others.

    Remember, pre-and post-trip inspections shouldn’t take more than half an hour each. That’s quite a small investment that could produce big returns. Get into the habit of running through them whenever you are at a truck parking lot, and it will pay dividends in the long haul.

    Bottom Line

    Of course, the overwhelming majority of you will carry out these basic tests as second nature. For those who may take it less seriously, we urge you to consider prioritizing pre-and post-trip inspections on your truck whenever you park it in a truck parking lot.

    If you are looking for a convenient place to park for the evening, look no further than Truck Parking Club. 

    We have thousands of private parking lots located all over America, so you are never too far from a spot to conduct your inspections and rest up. 

    Check out our easy-to-use platform today, browse for a truck parking spot, and see how we can make your life on the road a little easier!

    The information published herein is for general informational purposes only. Truck Parking Club does not make any representations or warranties about the completeness, reliability, legality, and accuracy of this information. Any reliance placed on such material is strictly at the user’s own risk. Truck Parking Club shall not be responsible for any losses or damages incurred in connection with the information published herein.